Price swings in the crypto market can wipe out accounts or multiply them overnight. If you have ever watched your portfolio drop 10% before breakfast and recover by lunch, you know that emotion is a terrible risk manager. That is where Historical Volatility (HV) is a statistical measure of past price fluctuations used to quantify asset risk. It strips away the hype and gives you cold, hard numbers about how wild an asset has been recently. For institutional traders, it is the baseline for every decision. For retail traders, it is often the missing piece that turns gambling into calculated risk.
What Is Historical Volatility in Crypto?
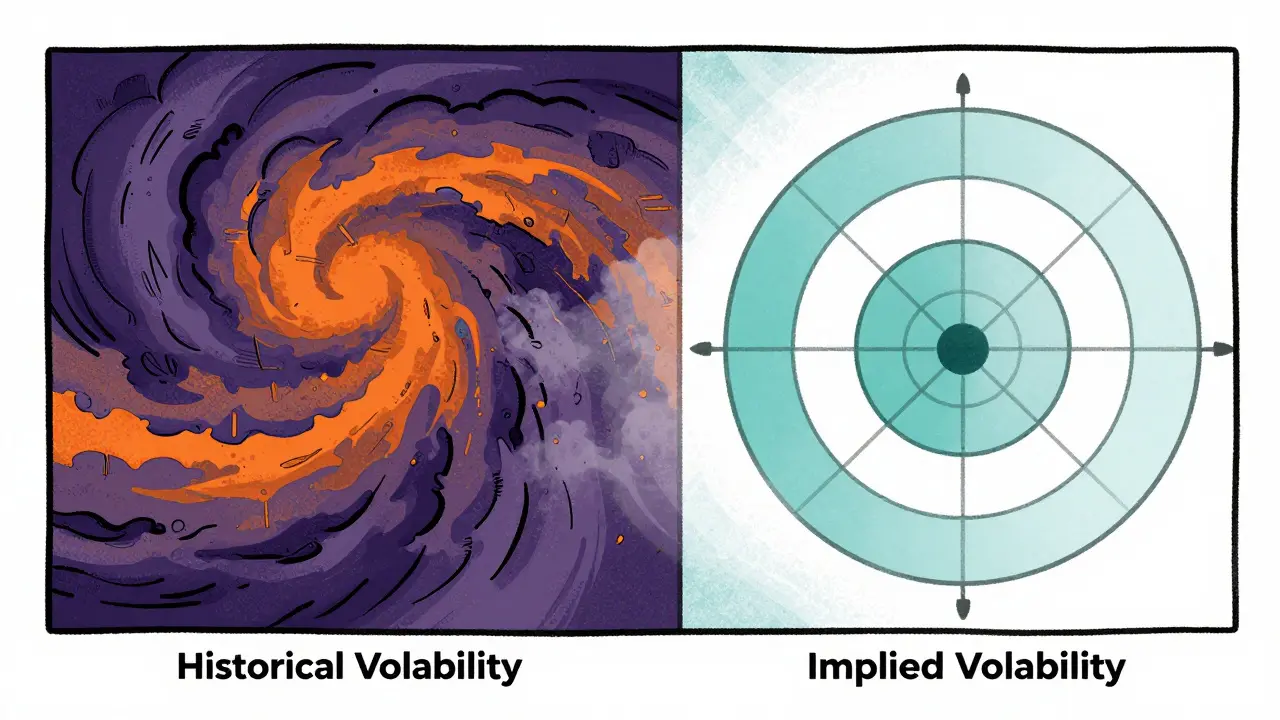
At its core, historical volatility measures how much an asset’s price has moved over a specific period. It does not predict direction; it measures intensity. Think of it like wind speed. The wind could be blowing north or south, but HV tells you if it is a gentle breeze or a hurricane. In financial terms, HV is calculated as the annualized standard deviation of returns. Most analysts use daily logarithmic returns over windows of 30, 60, or 90 days.
The methodology borrows from traditional finance but adapts to the unique chaos of digital assets. While stocks might move 1-2% on a normal day, cryptocurrencies are different beasts. During high activity periods between 2021 and 2023, Bitcoin’s 30-day historical volatility averaged around 75%. To put that in perspective, if Bitcoin had an average annual return of 10%, a 75% volatility means the price was swinging wildly around that mean. Ethereum typically runs hotter, showing 15-20 percentage points higher volatility than Bitcoin during the same timeframe. Stablecoins, on the other hand, sit at the bottom of the spectrum, with USDT and USDC hovering between 3-8% HV.
Why Historical Volatility Matters More Than You Think
You might wonder why you should care about a number that looks backward. The answer lies in position sizing and expectation management. If you know an asset has a 90-day HV of 80%, you expect massive swings. Entering a trade with tight stop-losses in such an environment is like trying to park a car in a hurricane-it will get hit regardless of your precision. Conversely, low volatility periods often precede explosive moves. Understanding this cycle helps you adjust your leverage and protect your capital.
Institutional adoption highlights this importance. According to Fidelity Digital Assets, 87% of institutional crypto traders rely on HV analysis for risk assessment. They do not just look at the chart; they integrate these metrics into their algorithms. Retail traders who ignore this data are essentially flying blind while institutions have radar. The gap in information asymmetry is narrowing, but only for those willing to learn the tools.
Calculating Volatility: From Simple to Sophisticated
Not all volatility calculations are created equal. Depending on your technical skill and data access, you can choose from several methods:
- Simple Standard Deviation: The most basic approach. It takes the closing prices over a set period (e.g., 30 days) and calculates the standard deviation. It is easy to understand but slow to react to sudden changes.
- Exponential Weighted Moving Average (EWMA): This method assigns more weight to recent price action. If volatility spikes today, EWMA reflects that faster than simple averages. It is a good middle ground for active traders.
- GARCH Models: Generalized Autoregressive Conditional Heteroskedasticity models, particularly GARCH(1,1), are the gold standard for professionals. They capture "volatility clustering"-the tendency for big moves to follow big moves. A 2025 study by UKM Malaysia found that GARCH(1,1) combined with Indicator Saturation techniques provides the most robust framework for identifying structural breaks in Bitcoin’s price series.
For most retail traders, starting with EWMA or using platform-built indicators is sufficient. Jumping straight into GARCH modeling requires quantitative finance training and significant time investment-around 80-100 hours according to Fidelity’s research. However, understanding that these advanced models exist helps you appreciate why professional forecasts might differ from your simple moving averages.
Historical vs. Implied Volatility: Know the Difference
This is where many traders trip up. Historical Volatility (HV) tells you what happened. Implied Volatility (IV) tells you what the market expects to happen. IV is derived from options pricing. If investors are buying lots of call options, IV goes up because they expect big moves.
Here is the catch: reliable IV data only exists for assets with liquid options markets. Currently, that means primarily Bitcoin and Ethereum. Deribit, the leading crypto options exchange, saw BTC options open interest reach $1.2 billion by late 2023. For altcoins like Solana or Cardano, there is no meaningful options market, so IV is either nonexistent or unreliable. For these assets, HV remains the sole quantifiable metric for risk.
| Metric | Data Source | Best For | Likely Lag/Error |
|---|---|---|---|
| Historical Volatility (HV) | Past Price Data | All Assets (BTC, ETH, Altcoins) | 12-18 days (Simple MA) |
| Implied Volatility (IV) | Options Pricing | BTC, ETH Only | Forward-looking bias |
| Realized Volatility | Intraday/Minute Data | High-Frequency Trading | Minimal (requires expensive data feeds) |
Practical Application: How to Use HV in Your Trades
Knowing the number is useless unless you act on it. Here is how successful traders incorporate HV into their workflow:
- Position Sizing: Higher HV demands smaller positions. If Bitcoin’s HV spikes to 90%, reduce your leverage. If it drops to 40%, you can safely increase exposure. This dynamic adjustment protects you from margin calls during unexpected spikes.
- Stop-Loss Placement: Setting a stop-loss too tight in a high-volatility environment guarantees you will be stopped out by noise. Use HV to calculate a buffer. A common rule of thumb is to set stops outside 2x the standard deviation of daily moves.
- Regime Detection: Watch for shifts. When HV compresses significantly after a long period of expansion, it often signals a consolidation phase before a breakout. Tools like TradingView’s Adaptive Volatility Bands can help visualize these regime changes automatically.
Research from UEEx Technology suggests that traders incorporating HV analysis improve performance by up to 20%. This gain comes not from predicting prices better, but from managing risk smarter. You lose less when you are wrong, which is the key to long-term profitability.

Tools and Resources for Tracking Volatility
You do not need a PhD in statistics to access this data. Several platforms make HV accessible:
- TradingView: Offers free built-in indicators for 30/60/90-day HV. It also hosts over 15,000 user-created scripts for custom volatility bands. Ideal for retail traders.
- CoinMarketCap/CoinGecko: Provide basic volatility trackers alongside price data. Good for quick checks but lack depth for serious analysis.
- Kaiko/CryptoCompare: Premium services offering high-frequency realized volatility and institutional-grade APIs. Costs range from $300 to $1,200 per month. Necessary for algorithmic traders requiring minute-level data accuracy.
- Bloomberg Terminal: The ultimate tool for institutions, featuring the Crypto Volatility Index introduced in Q1 2023. Prices start at $10,000+ per month.
For most individuals, TradingView combined with manual calculation checks is sufficient. The learning curve for basic HV interpretation is relatively short-about 10-15 hours of study according to educational materials from UEEx.
Limitations and Pitfalls to Avoid
HV is powerful, but it is not perfect. One major limitation is lag. Simple moving average-based HV can take 12-18 days to fully reflect a new volatility regime. By the time the indicator confirms a trend shift, the move may already be half over. Advanced models like GARCH reduce this lag to 3-5 days, but they require sophisticated implementation.
Another issue is data quality, especially for altcoins. Thin order books and exchange outages can create artificial volatility spikes. Dr. Lisa Chen’s research noted that standard HV calculations can have 15-22% measurement error during black swan events due to these factors. To mitigate this, use volume-weighted calculations or aggregate data from multiple reputable exchanges rather than relying on a single source.
Finally, remember that HV does not account for external shocks like regulatory announcements or exchange hacks. These events break historical patterns instantly. Always combine quantitative analysis with qualitative awareness of market news.
The Future of Volatility Analysis
The landscape is evolving rapidly. Machine learning models are beginning to integrate HV with on-chain metrics (like MVRV Z-Score) and macroeconomic indicators. A 2024 Arxiv study demonstrated that such hybrid models improved prediction accuracy to 82.4%, compared to 67.1% for traditional GARCH models alone. We are also seeing integration into DeFi protocols; Aave announced plans to use 7-day HV metrics for dynamic collateral adjustments in its V4 risk engine.
Regulatory pressures are also shaping the future. MiCA regulations in the EU require exchanges to publish daily volatility metrics starting mid-2024, and SEC guidelines mandate disclosure for crypto ETFs. This standardization will likely improve data reliability across the board. As markets mature, experts predict HV will converge toward traditional asset levels but remain 2-3 times higher through 2028. Until then, mastering historical volatility remains one of the highest-leverage skills a crypto trader can develop.
What is the best time frame for calculating historical volatility in crypto?
The industry standards are 30-day, 60-day, and 90-day windows. The 30-day window is most popular for active traders as it captures recent market sentiment without being overly noisy. Longer windows (60-90 days) provide a smoother view suitable for long-term investors assessing overall risk regimes.
Can I use historical volatility to predict future price movements?
No, historical volatility measures past price dispersion, not direction. It tells you how much an asset is likely to move, not whether it will go up or down. However, extreme compression in HV often precedes significant directional breakouts, providing context for potential entry points.
Is implied volatility better than historical volatility?
Implied volatility (IV) is forward-looking and based on options pricing, making it useful for gauging market expectations. However, IV is only reliable for assets with liquid options markets like Bitcoin and Ethereum. For most altcoins, historical volatility is the only available and reliable metric.
How does volatility affect position sizing?
Higher volatility requires smaller position sizes to maintain consistent risk exposure. If an asset's HV doubles, you should generally halve your position size to keep the potential dollar loss within your risk tolerance. This prevents large swings from wiping out your account prematurely.
What tools do I need to track historical volatility?
Retail traders can use free tools like TradingView, which offers built-in HV indicators. For more advanced needs, platforms like CoinMarketCap provide basic trackers. Institutional traders often pay for premium data feeds from Kaiko or Bloomberg to access high-frequency realized volatility data.


Miss Masquer
May 26, 2026 AT 06:18Oh my goodness, this is such a fantastic breakdown of something that feels so abstract until you actually see the numbers laid out like this. I have always been fascinated by how we can quantify chaos, and seeing the comparison between Bitcoin's 75% volatility and Ethereum's even wilder swings really puts things into perspective for me. It makes me think about how different our financial landscapes are becoming compared to traditional markets where everything felt so stable and predictable back in the day. The part about position sizing really resonated with me because I know so many people who lose sleep over small dips when they should be looking at the broader statistical picture instead. It is wonderful to see resources that help bridge the gap between institutional knowledge and retail traders who just want to protect their hard-earned money without needing a PhD in mathematics. Thank you for sharing this incredibly detailed guide that helps demystify these complex concepts for everyone involved in this exciting space.
Joshua Alcover
May 27, 2026 AT 00:50The epistemological framework presented herein relies heavily on Gaussian assumptions which are fundamentally flawed when applied to non-stationary stochastic processes inherent in decentralized ledger technologies. One must question the hegemonic imposition of Western financial metrics upon an inherently anarchic digital ecosystem that defies traditional regulatory capture. The reliance on GARCH models suggests a subservience to institutional paradigms that ignore the sovereign nature of cryptographic assets. Furthermore, the assertion that historical data predicts future risk is a fallacy born of linear thinking in a multidimensional market structure. We must reject the colonialist approach of applying fiat-era volatility measures to post-scarcity value stores.
Diana Morris
May 28, 2026 AT 16:23stop losing money already!!! hv is literally the only thing that matters if you want to survive this casino!! wake up and use the tools or get rekt!!!
Dianne Wright
May 29, 2026 AT 17:33i mean honestly why do people still trade crypto without checking hv its so obvious if you dont adjust your stops you deserve to get liquidated i told my friend this last week and he lost half his portfolio so yeah maybe listen to the math instead of your feelings
Eric Grosso
May 31, 2026 AT 03:29hey guys does anyone know if tradingview has a built in indicator for ewma specifically or do u have to code it yourself? i tried searching but found nothing useful so far
Rosie Morris
June 2, 2026 AT 01:34oh no poor eric dont worry u can just search for 'volatility bands' on the community scripts section usually someone has already made what u need its super easy to add just drag and drop
lorna erni
June 4, 2026 AT 00:50YES! exactly what i am talking about here!! we need more collaboration like this instead of fighting over charts!! let us all learn together and crush it this bull run!! who is ready to study hv with me??
stalin brian
June 4, 2026 AT 02:29honestly lorna thats a great idea i was thinking the same thing maybe we can start a group chat to share our hv settings it would be cool to compare notes from different countries too since market hours vary
kamal ifrani
June 4, 2026 AT 13:34you idiots are missing the point completely!! hv is just lagging garbage used by banks to trap retail traders!! real alpha comes from reading order flow and sentiment not some backward looking standard deviation!! stop being sheep and start thinking for yourselves before you blow up your accounts again
saradee dee
June 5, 2026 AT 13:18oh wow kamal you seem really upset today!! i guess everyone has their own strategy but for me hv helped me sleep better at night knowing my risks are calculated properly so maybe give it a chance?