When you look at a price chart for Bitcoin or Ethereum, you’re only seeing half the story. The real action happens behind the scenes-in the order book data. This isn’t just another indicator. It’s the live heartbeat of the market, showing exactly what buyers and sellers are willing to do right now-not what they did five minutes ago.
What Exactly Is an Order Book?
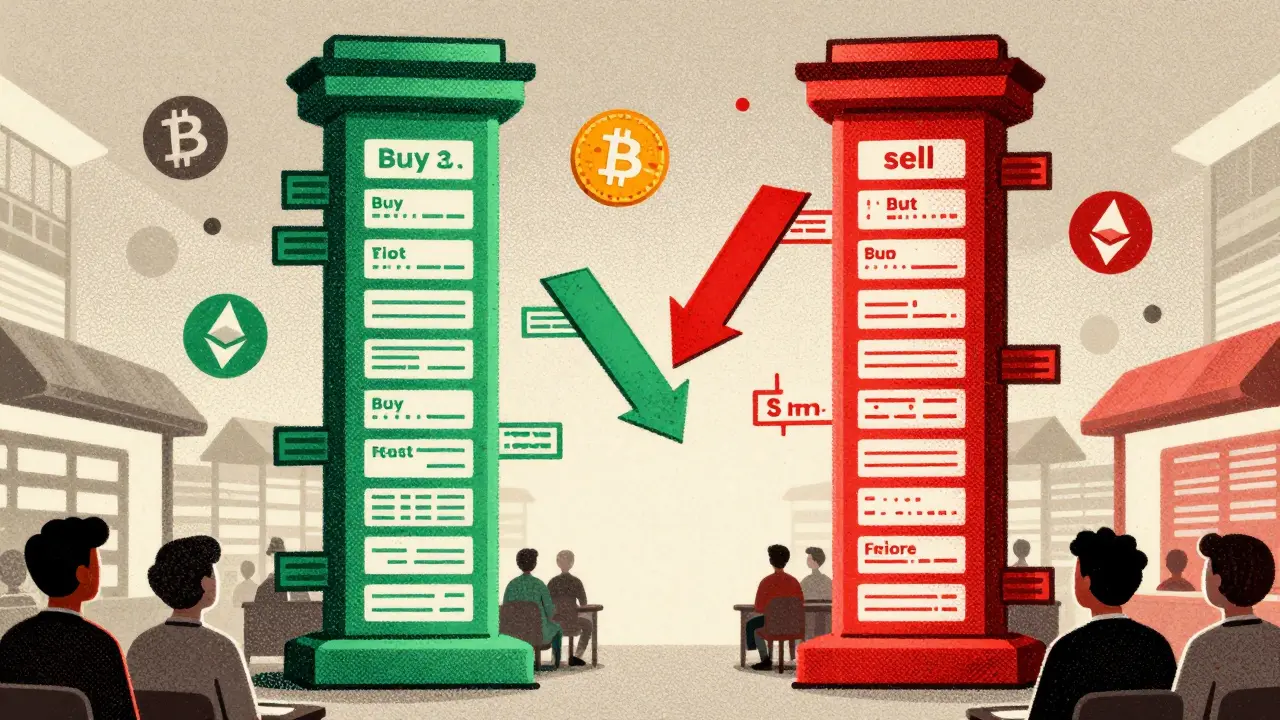
An order book is a real-time list of all pending buy and sell orders for a cryptocurrency. Think of it like a digital marketplace where everyone’s shouting their prices. On one side, buyers list how much they’re willing to pay (bids). On the other, sellers say how little they’ll accept (asks). These aren’t just random numbers-they’re organized from best to worst.Buy orders (bids) are sorted from highest to lowest. The top bid is called the best bid. Sell orders (asks) are sorted from lowest to highest. The lowest ask is the best ask. The gap between those two is the bid-ask spread. A narrow spread usually means the market is liquid-easy to trade without moving the price. A wide spread? That’s a red flag. It means there’s not enough buyers or sellers nearby to absorb your trade.
On Coinbase or Binance, you’ll see this as two columns: green for bids, red for asks. Each row shows a price level and the total amount of crypto available at that price. But here’s what most beginners miss: the numbers aren’t just static. They change every millisecond. Someone might cancel a large order, or a whale might dump 50 BTC all at once. That’s why reading the order book isn’t like reading a book-it’s like watching a live sports game.
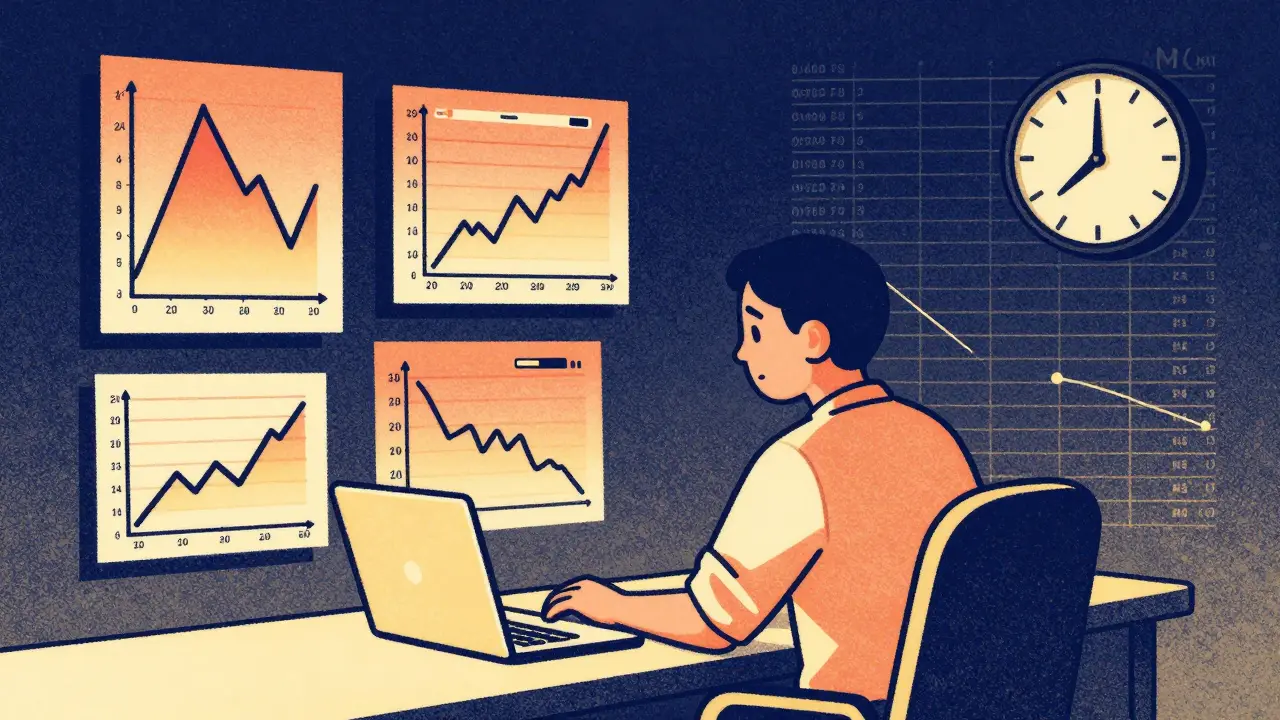
Why Order Book Data Beats Price Charts Alone
Price charts show you what happened. The order book shows you what’s about to happen.Let’s say Bitcoin is trading at $62,000. The chart looks flat. But if you check the order book, you see 300 BTC sitting at $61,800-way below the current price. That’s a hidden support level. It means a lot of buyers are waiting there to jump in. If the price drops to $61,800, it’s likely to bounce because those orders will absorb the selling pressure.
Conversely, if there’s a massive wall of sell orders at $63,500, that’s resistance. Even if the price rises toward it, those orders will push it back down unless someone has enough buying power to clear them all.
This is called market depth. It tells you how much volume exists at each price level. A deep order book means you can trade 10, 50, even 200 BTC without crashing the price. A shallow one? You’ll get slippage-your buy order fills at a worse price than expected. That’s why big traders always check the order book before placing a large order.
Reading the Signs: Order Flow and Market Sentiment
Beyond static levels, the movement of orders tells you about market sentiment.If you see a cluster of large buy orders suddenly appearing at $61,500, that’s a signal. Someone-probably an institutional player-is building a position. If those orders disappear just as the price hits $61,500? That’s spoofing. Someone placed fake bids to scare sellers into dropping their price, then canceled them and bought cheap.
On the flip side, if you see a steady stream of small sell orders being filled at $62,000, but no new bids are coming in, the market is losing momentum. Even if the price hasn’t dropped yet, the energy is draining.
Professional traders call this order flow analysis. It’s not about predicting the future-it’s about reading the current energy in the market. Are buyers aggressively chasing price? Are sellers dumping without hesitation? The order book gives you that signal in real time.
How Cryptocurrency Markets Make Order Books Unique
Crypto order books are different from stocks or forex. For one, they’re open 24/7. There’s no closing bell. That means liquidity can vanish overnight. A market that looked deep at 3 PM might be thin at 3 AM.Also, crypto exchanges don’t all have the same order books. A Bitcoin order book on Binance might look completely different from the one on Kraken. That’s why smart traders monitor multiple exchanges. If the price is $62,000 on Binance but $61,950 on Kraken, you can arbitrage-or at least spot which exchange has stronger demand.
And because crypto markets are less regulated, spoofing and wash trading are more common. You might see a huge bid at $62,500-only to see it vanish 0.3 seconds later. That’s not a sign of strength. It’s a trap. Learning to spot these tricks takes time.
Tools You Need to Use Order Book Data Effectively
Most exchanges show a basic order book, but that’s not enough for serious analysis.You need tools that show:
- Volume heatmaps-color-coded displays that show where the most liquidity sits
- Cumulative depth charts-how much total buy or sell volume exists up to each price level
- Order flow indicators-real-time tracking of large trades and cancellations
Platforms like TradingView, Coinigy, or DEX Screener offer these features. Some even let you backtest strategies using historical order book data. If you’re trading more than a few hundred dollars’ worth of crypto, you’re already behind if you’re only looking at candlesticks.
And don’t ignore the time frame. A 5-minute order book snapshot might look chaotic. But if you zoom out to 15 or 30 minutes, patterns emerge. Large orders often cluster around round numbers-$60,000, $61,000-because that’s where retail traders place their stop-losses and limit orders.
Common Mistakes and How to Avoid Them
Even experienced traders mess up with order book data. Here are the top three errors:- Chasing fake liquidity-Seeing a big bid and assuming it’s real. Always wait to see if it holds for more than 5-10 seconds.
- Ignoring the spread-Trading in a market with a 2% spread is like paying a 2% fee every time you enter. Avoid illiquid pairs.
- Overloading your screen-Trying to watch 10 different order books at once leads to analysis paralysis. Focus on one or two major pairs first.
Start simple. Pick one coin you trade often. Watch its order book for 30 minutes a day. Note where big bids and asks cluster. See how price reacts when those levels are hit. After a week, you’ll start seeing patterns. After a month, you’ll know when the market is about to move before the price does.
Order Book Data Is the Foundation of Smart Trading
Price charts are useful, but they’re history. Order book data is the present. It’s the only place where you can see the real balance of power between buyers and sellers.Whether you’re trading Bitcoin, Solana, or a new memecoin, the rules don’t change. Liquidity matters. Depth matters. Order flow matters. The people who win aren’t the ones who guess the next candle-they’re the ones who read the order book and understand what’s coming before it happens.
If you’re serious about trading crypto, stop ignoring the order book. It’s not optional. It’s the difference between guessing and knowing.
What is the bid-ask spread and why does it matter?
The bid-ask spread is the difference between the highest price a buyer is willing to pay (bid) and the lowest price a seller is willing to accept (ask). A narrow spread means the market is liquid and trading is efficient. A wide spread means there’s little competition between buyers and sellers, which can lead to slippage and higher trading costs. In crypto, spreads can widen dramatically during low-volume hours or major news events.
Can order book data predict price movements?
It doesn’t predict the future, but it reveals market pressure. If large buy orders are piling up just below the current price, it suggests strong support-and a potential bounce. If sell orders are accumulating above, resistance is forming. Traders use this to time entries and exits, not to forecast exact prices. Think of it as reading the wind before sailing, not reading a weather forecast.
What is spoofing in order book data?
Spoofing is when a trader places a large fake order-either a bid or ask-to trick others into thinking there’s strong demand or supply. Once others react, the spoofer cancels the order and trades in the opposite direction. It’s illegal on regulated exchanges, but common in crypto markets. Look for orders that appear suddenly, are large relative to normal volume, and vanish within seconds.
How do I know if a market has enough liquidity?
Check the cumulative depth at key price levels. If you can trade 10-20% of your intended position without moving the price more than 0.5%, the market is liquid. For Bitcoin or Ethereum on major exchanges, that’s usually true. For smaller altcoins, you might only be able to trade 1-2% before the price shifts. Avoid trading large amounts in shallow markets.
Do I need special software to use order book data?
You can view basic order books on any exchange, but to use it effectively, you need tools that show heatmaps, volume profiles, and order flow. Platforms like TradingView, Coinigy, or DEX Screener offer these features. Some even let you set alerts when large orders appear. Free tools work for beginners, but serious traders invest in professional data feeds.

nayan keshari
January 3, 2026 AT 00:59Order book data is overrated. I've made more money just watching price action and volume spikes than staring at green and red walls of orders. Most of these 'deep liquidity' claims are just noise. If you're waiting for a level to hold before trading, you're already late. The market doesn't care about your charts.
Johnny Delirious
January 3, 2026 AT 06:27Thank you for this exceptionally well-structured and intellectually rigorous exposition on the foundational mechanics of cryptocurrency order book analysis. This is precisely the kind of disciplined, data-driven methodology that separates professional market participants from retail speculators. The emphasis on liquidity profiles and order flow dynamics represents a paradigm shift in how traders should conceptualize market behavior. I urge all participants to internalize these principles as non-negotiable components of their trading discipline.
Bianca Martins
January 5, 2026 AT 00:02Really appreciate this breakdown - I used to ignore order books until I lost a bunch of money on a fake bid that vanished the second I clicked buy 😅
Now I always check cumulative depth on TradingView before trading any altcoin. If there's less than 50 BTC in total bids within 2% of current price, I walk away. Also, big red flag if you see a 200 BTC bid at $62.5k that disappears in 3 seconds - that's spoofing 101. Took me 6 months to stop falling for it.
alvin mislang
January 5, 2026 AT 03:15People still think this is 'analysis'? This is just gambling with fancy labels. You think watching order books makes you smarter? Nah. You're just deluding yourself into thinking you have an edge. The big players control the book. They create fake liquidity, manipulate spreads, and then wipe out retail traders who 'study the book'. This isn't trading - it's being a pawn in a game designed to bleed you dry. Wake up.
Monty Burn
January 5, 2026 AT 06:02Order book is just the surface tension of the market not the water underneath
What we see is the echo of intent not the intent itself
Every bid and ask is a whisper of fear or greed but the real movement comes from the silence between them
Price is the symptom order book is the cough the real disease is the system that rewards manipulation over truth
We chase patterns but the market is never patterned it is always becoming
Kenneth Mclaren
January 7, 2026 AT 02:47They don't want you to know this but every major exchange has a backdoor algorithm that artificially inflates order book depth during high volatility. It's called 'phantom liquidity injection' and it's used to trigger stop hunts. The 300 BTC bid at $61.8k? It's not real. It's a honey trap. The same group that placed it is already shorting the pump. They're using AI to simulate human behavior in the order book - and they're winning. The Fed, the exchanges, the whales - they're all in on it. You think you're reading the market? You're reading a script written by a bot that knows your next move before you do.